Factory View
See your factory like never before
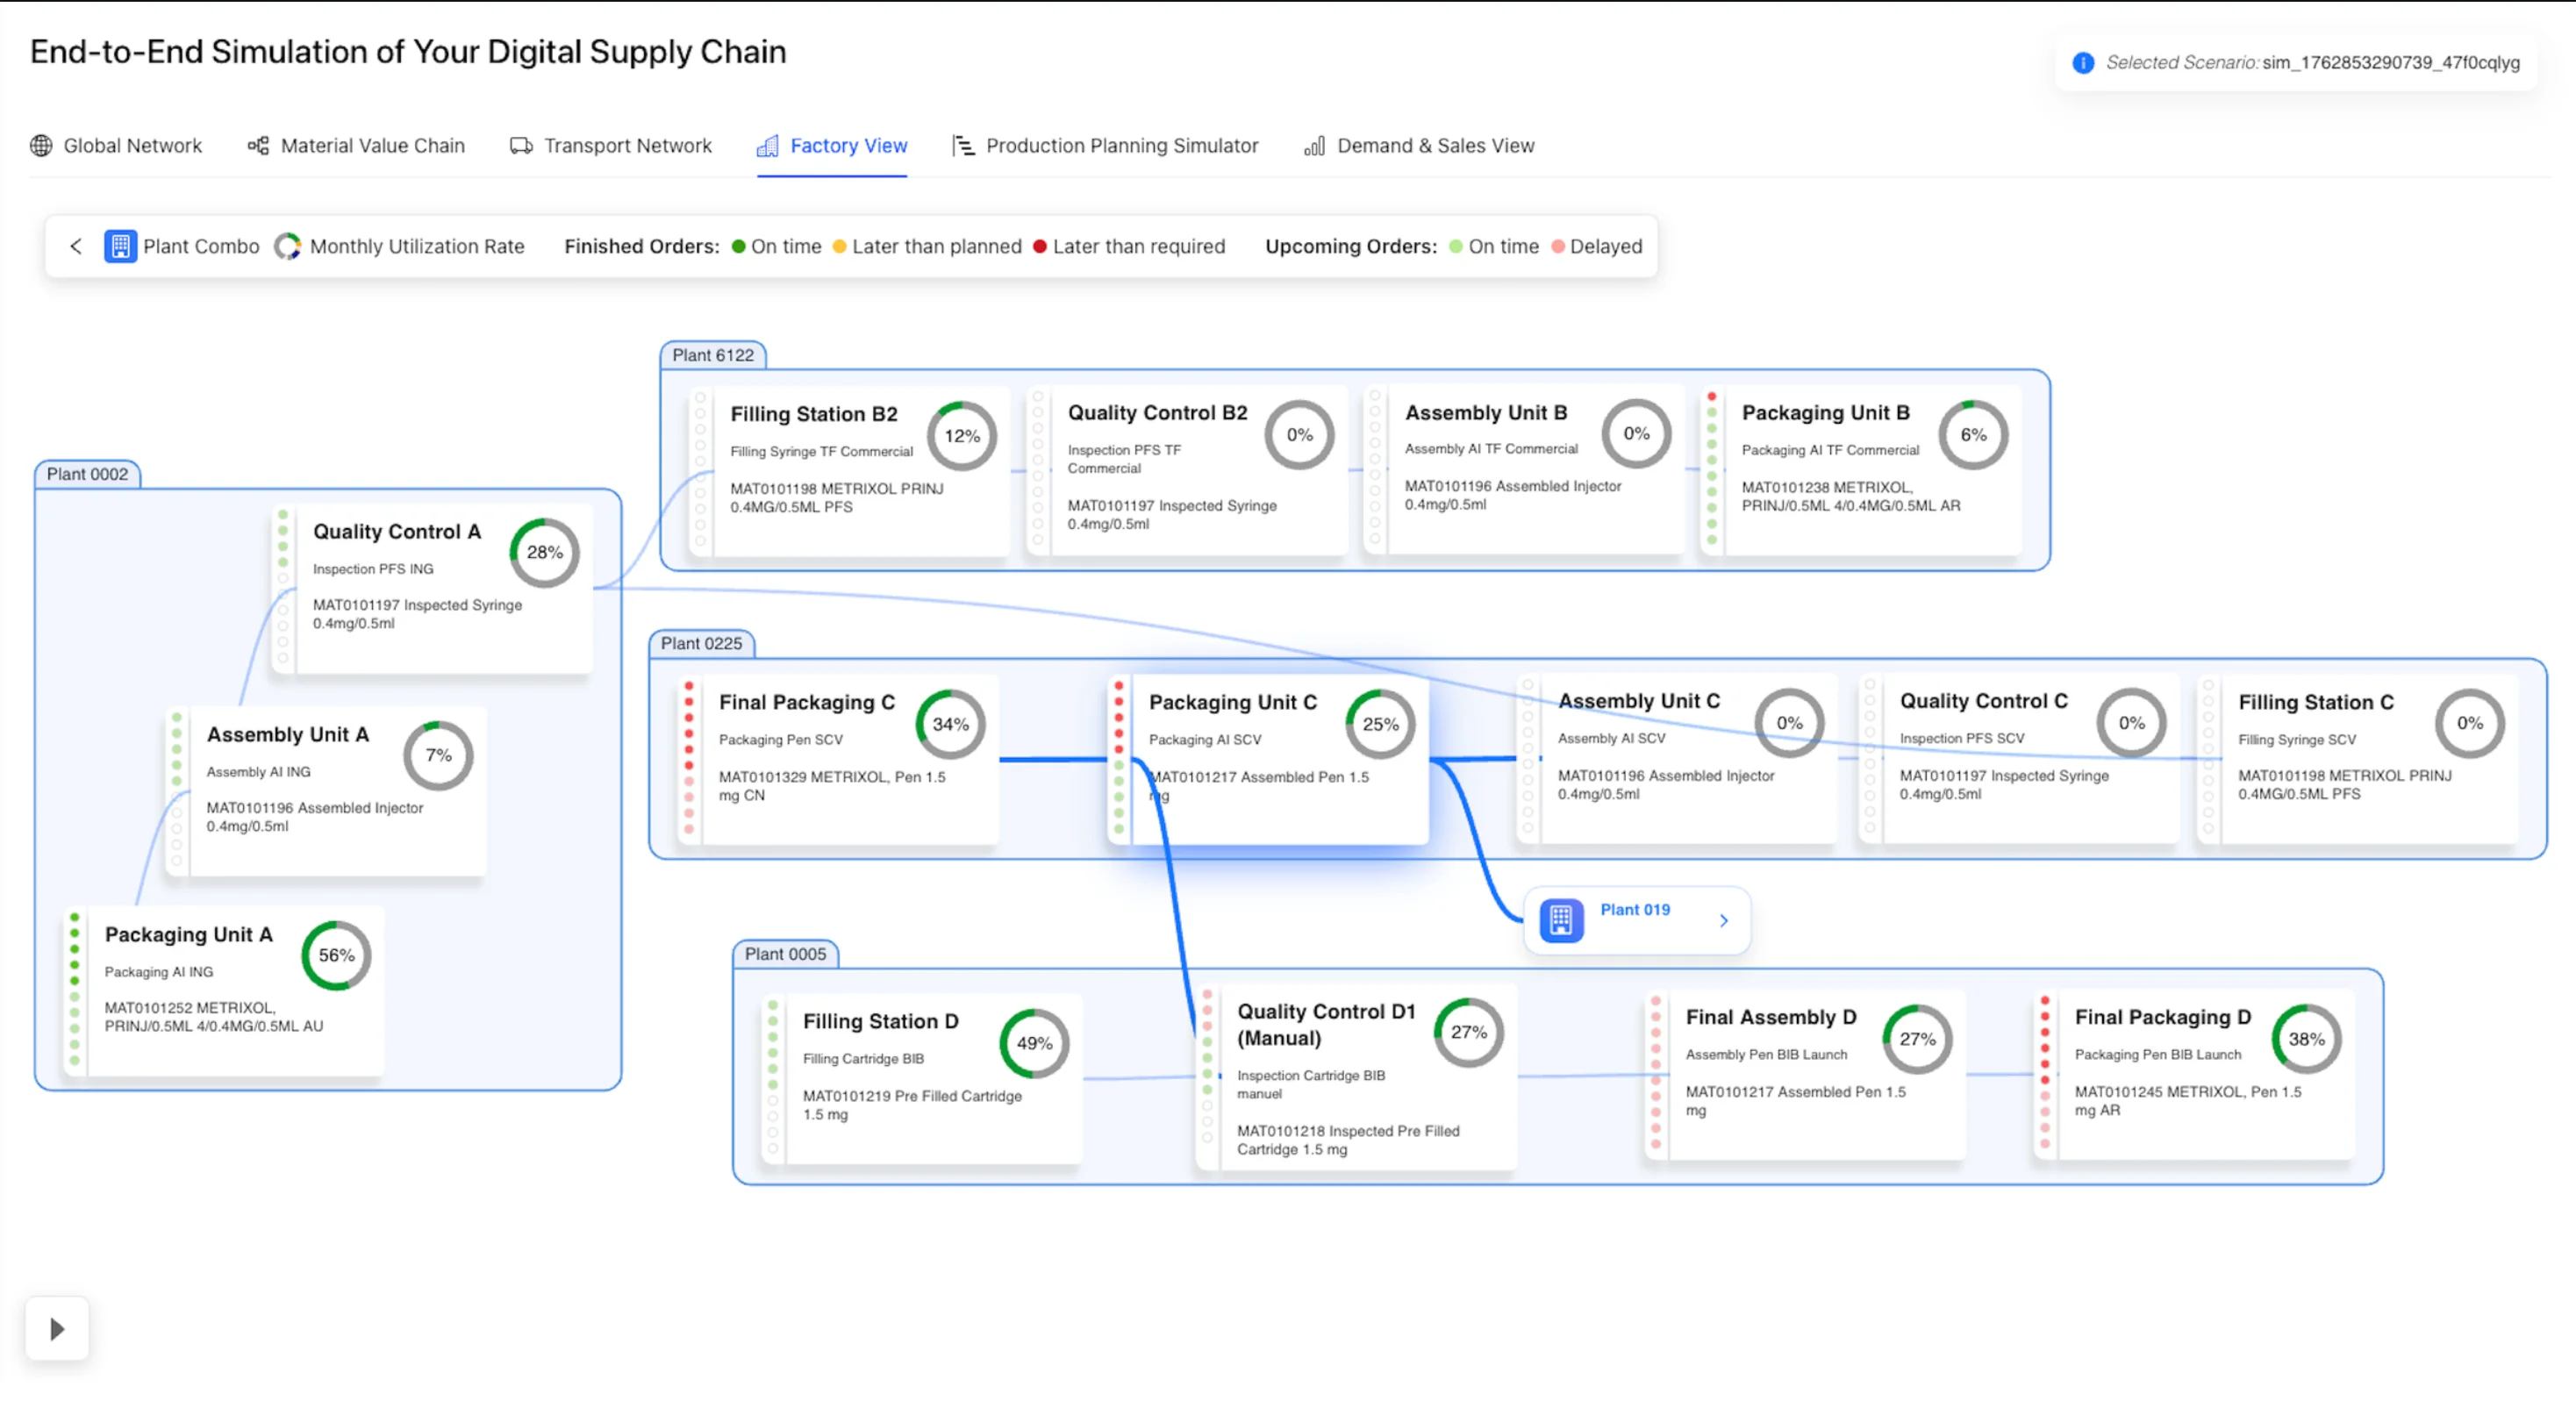
The Factory View gives you a clear, interactive overview of how your production really runs. From resource utilization to delays and idle times – it brings full transparency to your shop floor and helps you spot opportunities for improvement at a glance.
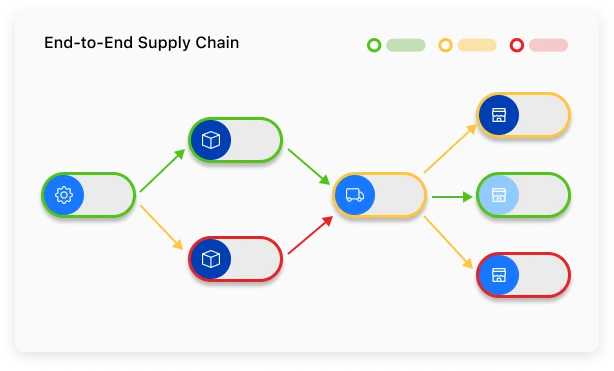
The Three Challenges of Factory Resource Management
Balancing capacity, performance, and efficiency is a constant struggle for production teams
Lack of Real-Time Visibility
Resource status is often siloed in disconnected systems, making it difficult to detect bottlenecks early.
Without a unified view of factory operations, production teams struggle to identify problems before they cascade into major delays and quality issues.
Inefficient Problem Diagnosis
Without clear indicators of utilization and delays, identifying the root cause of production issues becomes time-consuming.
Manual troubleshooting across multiple systems wastes valuable time and resources, leading to prolonged downtime and missed production targets.
Limited Optimization Insights
Static reporting prevents proactive adjustments and makes it hard to uncover recurring inefficiencies.
Traditional reporting only shows what happened in the past, missing opportunities for real-time optimization and continuous improvement.
Keep Your Production Flow Under Control in Every Condition
The Factory View transforms how production is managed by offering an interactive, real-time graph of all relevant resources
Graph Components / Features
Interactive Production Flow
Left-to-right graph dynamically visualizes complete production flows or filtered resource views.
Resource Nodes
Each node shows essential data, utilization, current status, and delay indicators at a glance.
Drill-Down Exploration
Clickable elements provide access to detailed information for root-cause analysis.
Cross-Graph Integration
Fully connected to other graphs in the platform, enabling smooth navigation to deeper insights.
Transform Your Factory Operations with Real-Time Visibility
Unlock efficiency gains and operational excellence through comprehensive factory transparency
Clear Factory Transparency
Understand instantly how resources are being used and where bottlenecks occur. Gain complete visibility into your production operations with an intuitive, interactive graph view.
Faster Problem Solving
Detect root causes of delays with real-time indicators and drill-down views. Reduce troubleshooting time from hours to minutes with targeted diagnostics.
Smarter Resource Allocation
Optimize workloads, balance utilization, and reduce idle times. Make data-driven decisions to maximize efficiency and throughput across all production resources.
Continuous Improvement
Spot recurring issues early and turn insights into sustainable efficiency gains. Build a culture of ongoing optimization with actionable data at your fingertips.

Moritz Kern
CEO
Ready to Transform Your Supply Chain?
Whether you're ready to request a demo or simply want to explore how our solution can benefit your business, we'd love to connect!
Get in Touch
Fill out the form below and we'll get back to you within 24 hours.